
As a treasury professional, managing cash flow forecasting can be time-consuming and prone to errors when done manually. This guide will walk you through creating your own Treasury Bot without coding knowledge or IT department involvement, even in complex scenarios where direct bank connections aren’t available.
What You’ll Learn
- How to automate cash flow data collection from multiple sources
- Setting up a robust forecasting system that adapts to your business rules
- Implementing scenario modeling for better decision-making
- Creating automated reporting and alerts
Prerequisites
- Microsoft Excel or Google Sheets
- Access to bank statements (downloadable CSV/Excel formats)
- Basic understanding of your company’s cash flow patterns
- Power Automate (formerly Microsoft Flow) or Zapier account (free tiers available)
Step 1: Design Your Treasury Bot Architecture
The Treasury Bot will consist of:
- Data Collection Layer: Automates gathering of bank statements, ERP data, and other cash flow inputs
- Processing Engine: Applies business rules to standardize and categorize transactions
- Forecasting Module: Projects future cash positions based on historical patterns and known future events
- Reporting Dashboard: Visualizes key metrics and alerts
Step 2: Setting Up Automated Data Collection
We’ll consider direct bank connections (via APIs, SWIFT) aren’t available, we’ll create a semi-automated system:
- Create a dedicated email folder for receiving bank statements and financial reports
- Set up Power Automate or Zapier to monitor this folder for new emails with attachments
- Configure the automation to extract attachments and save them to a centralized location
Example Power Automate flow:
- Trigger: “When a new email arrives in folder ‘Bank Statements'”
- Condition: “Email has attachments”
- Action: “Save attachments to OneDrive folder ‘Raw Data'”
- Action: “Send me a notification that new data is available”
For banks that don’t email statements, create a simple form (using Microsoft Forms or Google Forms) for your team to upload downloaded statements, which will then trigger the same workflow.
Step 3: Creating the Processing Engine
This is where your bot transforms raw data into usable information:
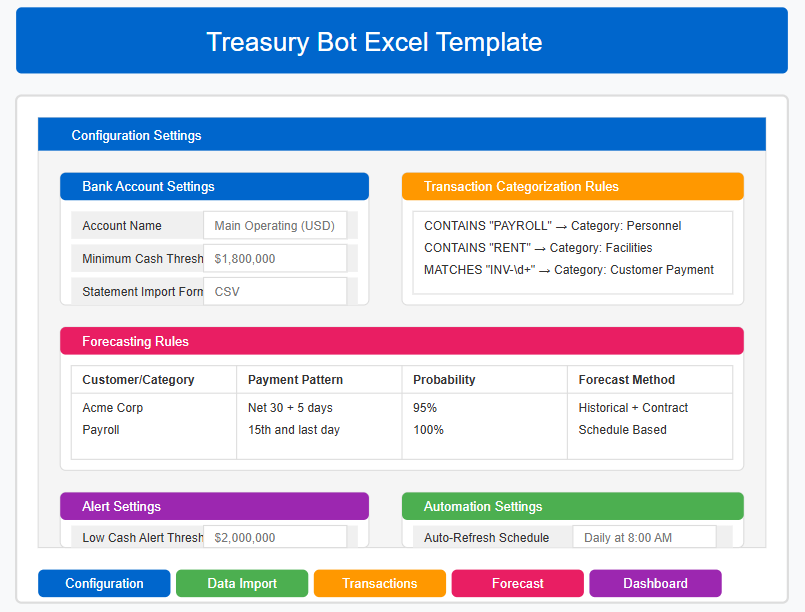
- Set up a master Excel workbook with these sheets:
- Configuration (business rules, mappings)
- Raw Data Import (temporary storage)
- Standardized Transactions
- Historical Cash Positions
- Forecast Calculations
- Dashboard
- Use Power Query in Excel to create transformations that:
- Import data from your storage location
- Standardize formats across different banks
- Map transaction descriptions to categories
- Consolidate multiple currencies
Example mapping rules for transaction categorization:
- If description contains “RENT” or “LEASE” → Category = “Facilities”
- If description contains “SALARY” or “PAYROLL” → Category = “Personnel”
- Custom regex patterns for recurring customers or suppliers
- Configure refresh schedules so your workbook updates automatically when new data arrives
Step 4: Building the Forecasting Module
- Historical pattern analysis:
- Create a pivot table analyzing cash flows by category, day of month, and seasonality
- Calculate typical timing of recurring payments/receipts (e.g., customers who pay 7-10 days after month-end)
- Future events calendar:
- Create a sheet to track known future events (tax payments, dividends, major purchases)
- Include formulas to calculate impact on cash position
- Probabilistic forecasting:
- For each major customer/supplier, create a probability distribution of payment timing
- Use FORECAST.ETS functions in Excel to project forward with confidence intervals
- Scenario modeling:
- Create data tables that model different scenarios (delay in key customer payment, currency fluctuations)
- Use Excel’s What-If Analysis tools to simulate impacts
Step 5: Creating the Dashboard and Alerts
- Build a cash position dashboard with:
- Current cash by bank account and currency
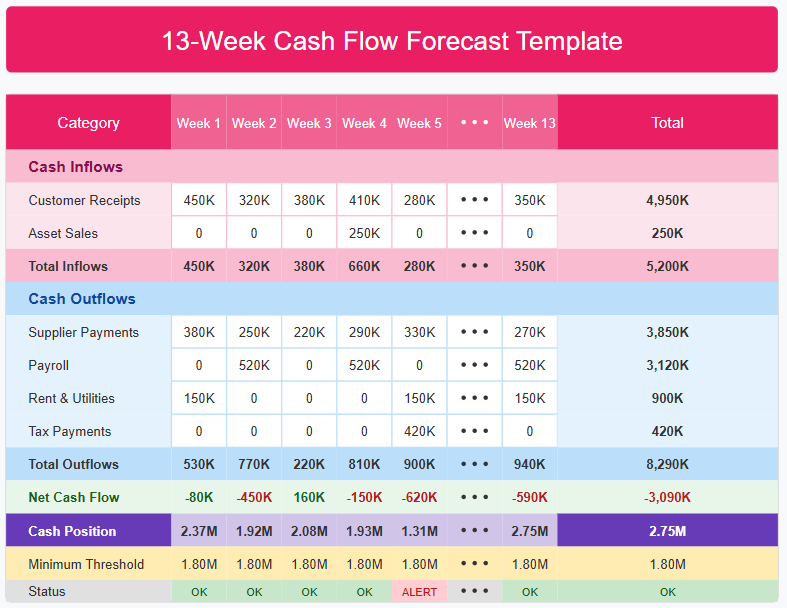
- 13-week rolling forecast chart
- Key risk indicators (e.g., “Days until minimum cash threshold breached”)
- Scenario comparison charts
- Set up conditional formatting alerts:
- Red/yellow/green status for cash levels
- Highlighting of unusual transactions or variances
- Visual indicators for forecast confidence levels
- Configure Power Automate to send alerts when:
- Cash is projected to fall below minimum threshold
- Large unexpected transactions appear
- Payment deadlines are approaching
Example alert rule:
- If projected cash < $500,000 within next 7 days
- AND no pending large receipts identified
- THEN send high-priority email to Treasury team
Step 6: Extra – Handling Complex Scenarios
Multiple Currencies
- Create a currency conversion table that updates daily (can be linked to a public API via Power Automate)
- Build forecasts in both local and reporting currencies
- Add a currency impact analysis section to model exchange rate volatility
Intercompany Cash Pools
- Create a matrix showing intercompany positions
- Set up rules to suggest optimal internal funding movements
- Track internal loans and notional cash pooling arrangements
Subsidiary Integration
- Create standardized templates for subsidiaries to report forecasts
- Set up automated consolidation of these inputs
- Include reliability scores for each subsidiary based on historical accuracy
Debt Covenant Compliance
- Configure tracking of relevant covenants (debt/EBITDA, interest coverage)
- Set up forward-looking covenant compliance forecasts
- Create early warning alerts when approaching thresholds
Step 7: Continuous Improvement
- Track forecast accuracy:
- Compare projected vs. actual cash flows
- Calculate error rates by category and time horizon
- Use findings to refine forecasting logic
- Implement machine learning (no-code):
- Connect your Excel data to Microsoft Power BI
- Use built-in AI insights to identify patterns
- Apply AutoML predictions to improve forecasts
- Build a feedback loop:
- Create a simple form for team members to report unusual transactions or events
- Configure the bot to incorporate this feedback into future forecasts
Example: Complex Multinational Treasury Scenario
Let’s walk through setting up this system for an imaginary manufacturing company with:
- 5 subsidiaries in different countries
- 12 bank accounts across 4 currencies
- Seasonal business with large inventory purchases
- Complex intercompany financing arrangements
Data Collection Setup
- Create email rule categories for:
- Daily bank statements (EUR, USD, GBP, JPY)
- Weekly subsidiary reports
- Monthly ERP extracts (AR/AP aging)
- Configure Power Automate flows for each category:
- Parse bank CSVs into standardized format
- Extract subsidiary forecasts from Excel attachments
- Convert AR/AP aging reports into cash timing projections
Processing Logic
- Bank transaction categorization:
- Create a dictionary of 200+ common transaction descriptions
- Build rules to identify patterns in narration fields
- Set up exception handling for unmatched transactions
- Cash allocation rules:
- If incoming payment matches outstanding invoice → link to customer
- If multiple partial matches → allocate using FIFO method
- If no match → flag for manual review
Forecasting Complexity
- Create customer-specific payment timing profiles:
- Company A: Pays 30 days late, 95% confidence
- Company B: Pays on time if <$10K, 15 days late if >$10K
- Company C: 60% chance of paying next Friday, 40% chance of paying in 30 days
- Implement rolling 13-week forecast with:
- Known AR/AP from ERP system for first 4 weeks
- Statistical projections for weeks 5-13
- Overlaid with seasonality factors
- Adjusted for payment timing patterns
Alert System
Configure critical alerts for:
- USD cash position projected below $2M within 3 weeks
- EUR intercompany balances exceeding €5M
- Subsidiary forecasts not received by Thursday
- Covenant ratio projected to breach within 60 days
Conclusion
You can build a Treasury Bot that automates cash flow forecasting without writing code or involving IT. The system collects data automatically, applies your business rules to standardize and categorize transactions, generates forecasts based on historical patterns and known future events, and provides clear visualizations and alerts to support decision-making.
While not as seamless as a direct bank API connection, this approach delivers significant time savings and improved accuracy compared to manual processes. As your needs evolve, you can continue enhancing your bot with additional rules, more sophisticated forecasting models, and expanded scenario capabilities.
For more complex situation, you could create a dashboard in Power BI or any other tool to summarize the data collected by your Bot.


Leave a Comment
You must be logged in to post a comment.