Understanding Transfer Pricing in Treasury
Transfer pricing in treasury is the methodology for determining the internal cost of funds between different business units, subsidiaries, or geographical regions within a multinational corporation. Unlike traditional transfer pricing for goods and services, treasury transfer pricing focuses on the cost of capital, liquidity, and financial risk allocation.
Think of it as creating an internal bank within your organization. Each business unit “borrows” or “deposits” funds at rates that reflect their true cost of capital, credit risk, and contribution to the overall financial position of the company.
Core Components of Treasury Transfer Pricing
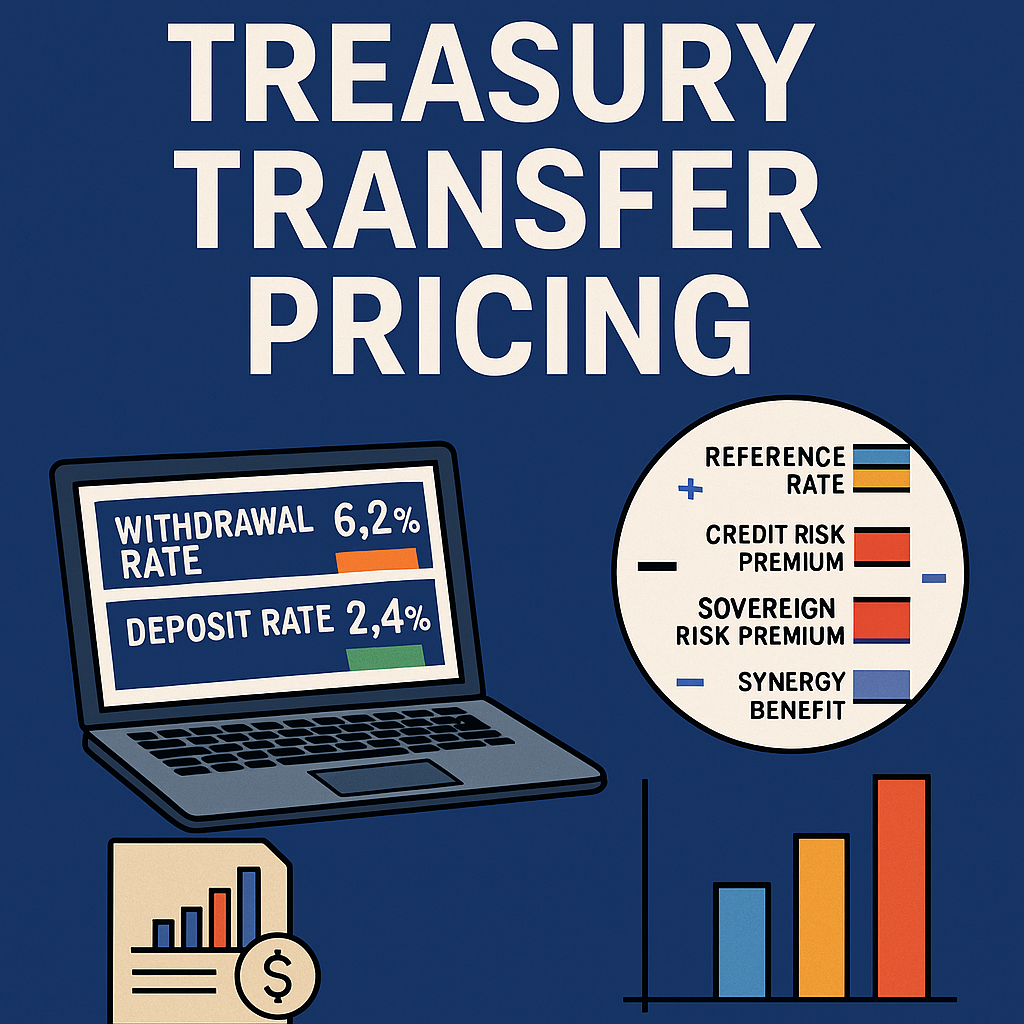
1. Reference Rate. The reference rate serves as your baseline – typically the risk-free rate for the relevant currency and tenor (e.g., daily interest rate). This represents the cost of funds without any risk premiums.
2. Credit Risk Premium This premium reflects the creditworthiness of the specific business unit or subsidiary. A unit with poor cash flow predictability will pay a higher premium than a stable, profitable division.
3. Sovereign Risk Premium For multinational operations, this accounts for country-specific risks. A subsidiary in an emerging market will typically carry a higher sovereign risk premium than one in a developed economy.
4. Deposit and Withdrawal Margins
- Deposit Margin: The spread your treasury center earns on excess cash deposited by business units
- Withdrawal Margin: The additional cost charged to business units that require funding
Transfer Pricing as a Risk Management Strategy
Treasury transfer pricing transforms risk management from reactive to proactive by:
- Risk Allocation Clarity Each business unit bears the true cost of their financial risk profile. This incentives better cash flow management and capital efficiency at the operational level.
- Centralized Risk Optimization Your treasury function can pool risks across the organization, achieving better overall pricing through diversification benefits (synergy margin).
- Performance Measurement Business units are evaluated on their true economic performance, not distorted by subsidized or penalized cost of capital.
- Regulatory Compliance Proper documentation of transfer pricing methodologies helps defend against tax authority challenges and ensures arms-length pricing.
Practical Risk Management Applications
- Liquidity Risk Management By charging units for their liquidity usage patterns, you encourage better cash forecasting and reduce overall liquidity requirements.
- Credit Risk Distribution Units with higher credit risk pay accordingly, creating natural incentives for risk reduction while protecting the overall credit rating of the parent company.
- FX Risk Allocation Transfer pricing can embed currency hedging costs, ensuring units understand and manage their true FX exposure.
Implementation
Technology Stack Requirements
To implement a transfer pricing schema for treasury, you need technologies that can support data integration, rule-based allocations, inter-company transactions, and reporting.
- Treasury Management System (TMS) – essential for managing in-house bank structures, inter-company loans, and centralized cash pooling. A TMS executes internal cash flows and interest allocation, tracks inter-company positions, helps consolidate bilateral flows and settle net amounts (Netting), imports daily the interest rates and calculates daily interest. Examples: Coupa Treasury (Bellin), Kyriba, FIS Integrity, SAP Treasury
- Enterprise Resource Planning (ERP) to post intercompany interest charges, and ensures compliance with financial reporting. Examples: SAP, Oracle, Microsoft Dynamics
- Reporting – a TMS will also generate inter-company statements
- Transfer Pricing tool – to calculate transfer pricing allocations and justifications
Implementation Approach for Non-Technical Teams
Phase 1: Data Foundation Start with your existing systems. Most ERP/ TMS can export the necessary data:
- Cash positions by entity
- Intercompany loan balances
- Credit ratings by subsidiary
- Historical cash flow volatility
Phase 2: Calculation Engine Build your transfer pricing engine using enhanced Excel or cloud-based calculation platforms:
- Rate calculation formulas
- Margin determination logic
- Automated reports based on calculations
Key Technology Solutions
For Small to Medium Organizations:
- Microsoft Excel + Power Query: Enhanced spreadsheet capabilities with automated data refresh
- Treasury software like GTreasury or Kyriba: Mid-market solutions with transfer pricing modules
- Cloud platforms like Anaplan or Zanders: Purpose-built for financial modeling and calculations
For Large Organizations:
- ERP: Enterprise-grade with built-in transfer pricing functionality
- TMRS: Specialized treasury and risk management platform
- Zanders Pricing tool.
Transfer Pricing Calculation Framework
The total cost of funds for any business unit is calculated as:
Withdrawal Rate = Reference Rate + Credit Risk Premium + Sovereign Risk Premium + Withdrawal Margin – Synergy Benefit
- Reference Rate: e.g. EURIBOR, LIBOR, SOFR
- Credit Risk Premium: based on the borrower’s risk rating
- Sovereign Risk Premium: if the borrowing entity is in a higher-risk country
- Withdrawal Margin: internal margin added by the treasury
- Synergy Benefit: optional discount for being part of the group (economies of scale). This lowers the rate the affiliate pays, so it’s subtracted.
Deposit Rate = Reference Rate – Deposit Margin + Synergy Benefit
- Deposit Margin: retained by the treasury as a profit/spread
- Synergy Benefit: bonus for providing liquidity to the group — often a small uplift
Treasury Spread = Withdrawal Rate – Deposit Rate
- This shows how treasury generates internal profit, which can later be allocated or pooled.
Detailed Calculation Components
Reference Rate: is the base rate used in calculating both internal lending (withdrawal) and deposit rates within a group. It serves as a neutral benchmark, independent of entity-specific risks, and is the foundation of a fair and compliant transfer pricing framework.
| Currency | Common Reference Rates |
|---|---|
| USD | SOFR, USD OIS |
| EUR | EURIBOR, €STR |
| GBP | SONIA |
| RON | ROBOR, RIR (ROIS benchmark) |
| Multi-currency | Risk-Free Rate curves |
Credit Risk Premium Calculation:
Credit Risk Premium = (Stand-alone Credit Spread) – (Pooled Credit Spread)
Synergy Margin Benefit: This represents the value of being part of a larger, diversified organization:
Synergy Margin = Weighted Average Cost of Capital Benefit × Diversification Factor
Total Pooled Rates:
Total Pooled Deposit Rate = Reference Rate – Deposit Margin + Synergy Benefit
Total Pooled Withdrawal Rate = Reference Rate + Credit Risk Premium + Sovereign Risk Premium + Withdrawal Margin – Synergy Benefit
Business Case Example
Company Profile: Meet again my GlobalTech, my multi-trillion dollar company with operations in US, Germany, and Brazil
Current Challenge:
- US subsidiary has $50M excess cash earning 0.1%
- German subsidiary needs $30M funding, paying external bank 4.5%
- Brazilian subsidiary requires $20M, paying local bank 8.2%
- No formal transfer pricing system
Implementation Results:
Before Transfer Pricing:
- Total external funding cost: ($30M × 4.5%) + ($20M × 8.2%) = $3.0M annually
- Excess cash return: $50M × 0.1% = $0.05M annually
- Net Cost: $2.95M
After Transfer Pricing Implementation:
- Internal funding at optimized rates
- US excess cash earns 2.8% (Reference Rate 2.5% – Deposit Margin 0.2% + Synergy 0.5%)
- German unit pays 3.8% (Reference Rate 2.5% + Credit Premium 0.8% + Withdrawal Margin 0.5%)
- Brazilian unit pays 6.2% (Reference Rate 2.5% + Credit Premium 0.8% + Sovereign Premium 2.4% + Withdrawal Margin 0.5%)
Results:
- Internal funding income: $50M × 2.8% = $1.4M
- Reduced external funding: Only $0 needed externally
- Net Benefit: $1.4M annually
- Total Improvement: $4.35M annually
Technology Implementation Roadmap
Step 1: Assessment and Design
- Audit current data sources
- Design transfer pricing policy
- Select technology platform
Step 2: Build and Test
- Develop calculation models
- Create reporting templates
- Test with historical data
Step 3: Deploy and Train
- Roll out to pilot business units
- Train finance teams
- Establish governance processes
Step 4: Optimize and Scale
- Monitor performance
- Refine calculations based on results
- Expand to all business units
Measuring Success
Key Performance Indicators:
- Reduction in external funding costs
- Improvement in cash utilization efficiency
- Enhanced business unit performance measurement accuracy
- Decreased regulatory compliance risks
Technology ROI Metrics:
- Time savings in monthly reporting (target: 75% reduction)
- Accuracy improvement in cost allocation
- Reduced audit preparation time
- Enhanced decision-making speed
While transfer pricing defines how internal funding is priced, it also has critical tax implications. From intercompany interest deductibility to withholding tax and global minimum tax rules, treasury professionals must ensure compliance across jurisdictions. Discover these challenges and how to navigate them in the article Tax Considerations for Treasury.
Try it yourself: To help you put theory into practice, we’ve created a free, interactive Transfer Pricing Calculator. This tool lets you input your entity-specific parameters—like credit rating, country risk, and internal margins—and instantly calculates both withdrawal and deposit rates. It’s a practical way to explore how internal pricing works and how synergy benefits impact your treasury spread.
Happy pricing!


